April is here and it is time for another installment of our Los Angeles Real Estate Market Inventory Report. Each month we construct this report with the intention of providing our agents, peers, and clients, with the information they need to make clear and calculated decisions based off statistical market findings and trends.
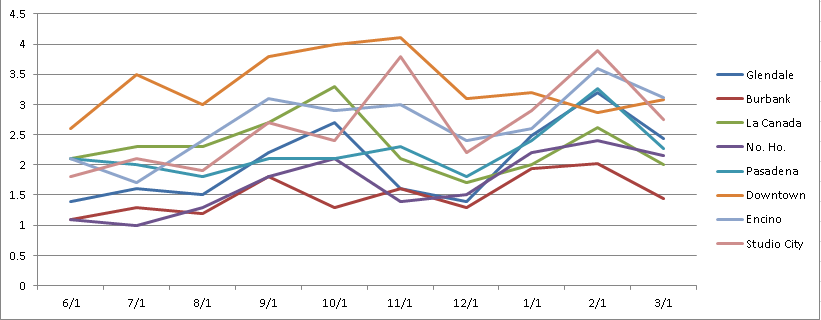
Below we have included a graph and table showing the current “Months of Inventory” in the Glendale, Burbank, La Canada Flintridge, North Hollywood (No. Ho.), Pasadena, and Downtown Los Angeles (DTLA).
This month we have added two new cities into the mix: Encino and Studio City, enjoy!
February recap – A spike in supply was observed in every city we examined except in Downtown Los Angeles. This “spike”represented an increase in new listings from January to February, in contrast to the number of properties sold staying relatively inline with that of January. From this we were able to determine that demand remained stable, while supply increased.
For the month of March we have observed that demand outpaced supply in every market except for DTLA, where supply outpaced demand. While it may be difficult to see this trend (demand out pacing supply) by only looking at the “months of inventory” figure – since it can decrease due to an increase in demand or a decrease in supply – when we looked closer we found that while the number of properties for sale (supply) did increase, the number of properties sold (demand) increased by a greater amount. Never satisfied with “what” and wanting to know “why”, I decided to look a little deeper for the answer to “why” we are seeing a greater increase in demand than supply.
First I began to compare the average prices across the markets and where they were in the previous month – to rule out the possibility that more buyers entered the market because of lower asking prices across the board. After comparing the average listing prices, sold prices, and price per square foot metrics, I was able to see that prices remained in line with where they were in the previous month, and that a reduction in price was not a likely cause for the increase in demand.
Then I began to consider the idea that the increase in demand is simply due to the fact that real estate is a very seasonal industry, and springtime is of the hotter seasons in which to buy and sell. So, I looked back into last years figures to see if the same trend was observed at that time as well. My suspicions were confirmed – the increase in demand we saw last month is likely due to the “ebb and flow” nature of the housing market.
Tides are just beginning to change – whether or not they will continue in this direction we do not know, but we can say with some certainty that if there is any point in time throughout the year we can expect this to happen, now is that time. Spring is in the air, carrying with it the scent of freshly printed real estate signs and escrow checks!
Let us know where you think the market is headed, in the comments below!
After working with, and for, many different real estate firms, it became apparent to Harout that there was a major disconnect between what consumers needed/wanted and the service that was being provided to them. It was upon this realization that Harout founded and opened JohnHart Real Estate; and as the CEO/Principal Broker he has continued to break from the norm and redefine real estate with an insatiable appetite to give his clients the service and attention they deserve.


