While many Southern California cities have suffered drastic losses in home prices, Santa Monica appears to have escaped relatively unscathed!
If you are not familiar with Santa Monica, allow me to give you a brief run down on it. This quaint beachfront town of approximately 90,000 residents has long been sought after for its laid back vibe, and cool ocean breeze. During the 80’s the city really took off as a mecca for artists and the counter-culture as a whole; and while there has been a good deal of demand for property, it really took off during this period.
Home to the “third street promenade”, and the recently finished “Santa Monica Place” shops, this area has never been much of a stranger to the higher end boutiques and stores that often signify a city with well to do residents. This being said, what you are about to see make shock you. In fact if you are a homeowner in other parts of Los Angeles, it may even anger you! But you have to see it to believe it.
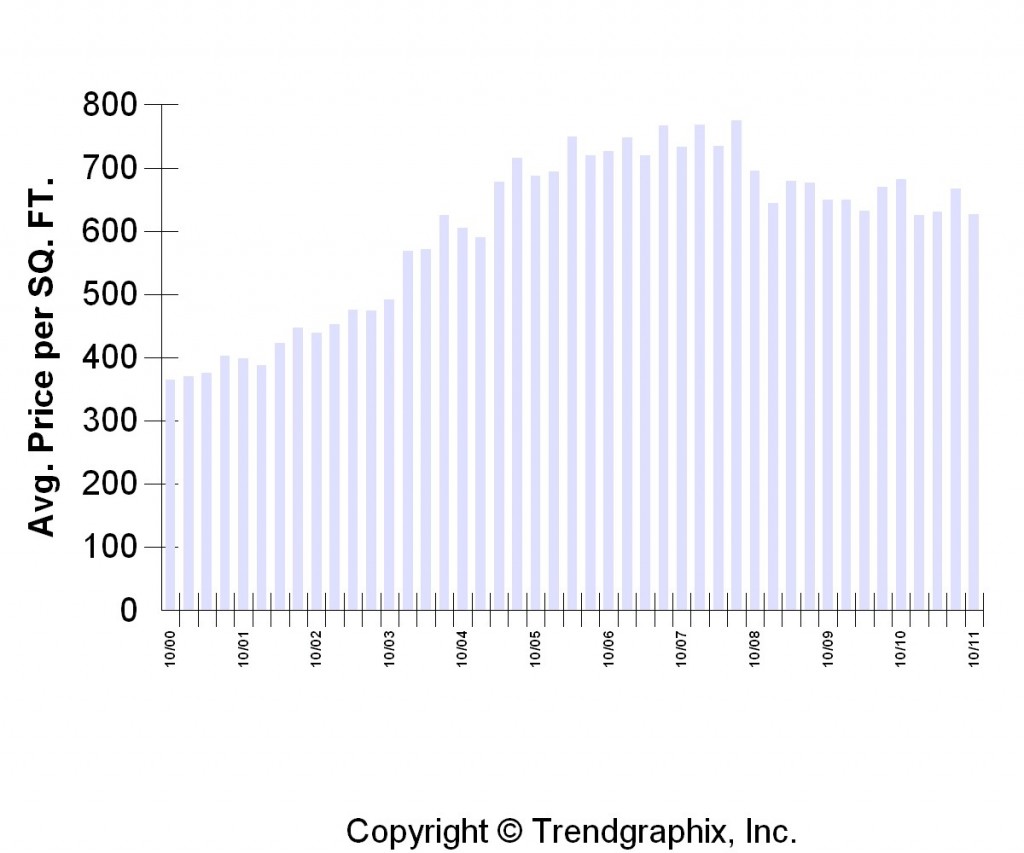
The graph below represents the average price per square foot on properties in Santa Monica over the past 11 years. Lets take a look:
No, your eyes are not deceiving; And yes, this graph is almost the complete opposite of what has happened in every other LA neighborhood! Out of all the cities I have examined, this one has experienced the least change in values post-housing market crash.
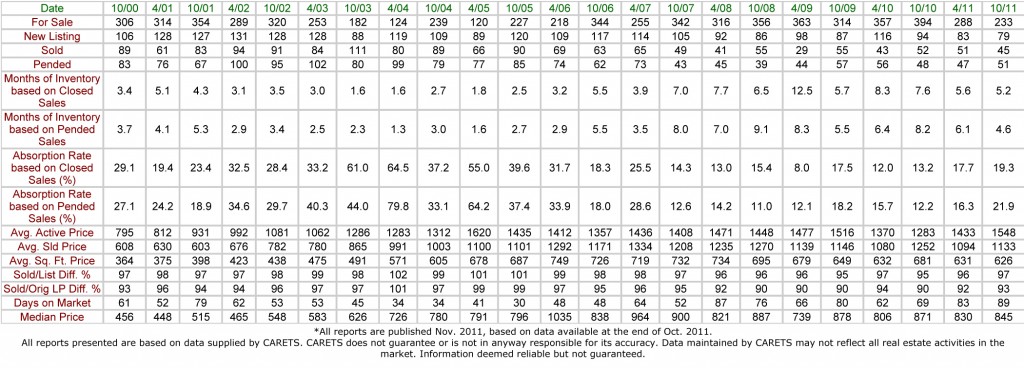
As we all know, one key performance indicator is not enough to support a hypothesis, nor is it enough to make a recommendation with. Therefore let’s examine the data table below to find out how one should act if interested in this area.
 (click on the image to enlarge)
Starting from the top, we can see that there has been an increase in the number of properties for sale, peaking around the time of the to economic bubble bursts (tech in 00-01, and housing in 07-09), and then slowly winding down several years afterwards. That being said, this is really the only KPI that follows this pattern. the rest seem to follow a fairly steady incline (with a few spikes here an there, but nothing to negate this pattern). It seems based on this data that the market is holding steady due to demand.
I believe that the bolstering of this market is chiefly due to the economic condition of its inhabitants, and the fact that most of them are well to do business people who are gainfully employed (due to the fact that they are not easily replaceable). In lower socio-economic areas, one typically finds a surplus of under educated individuals who unfortunately are often the ones who find themselves unemployed (because they are replaceable with lower cost options; there is no shortage of unemployed individuals who will take your job with a pay cut!). The resulting unemployment causes defaulting on mortgages, which leads to foreclosure, which as we all know: brings down the value of surrounding properties. <<< This is exactly what Santa Monica has not had to suffer through.
My recommendations for this market is to buy into it, if you are looking to move into this area. If you already live here I would recommend considering a refinance, as you most likely have equity and rates have never been lower; however if you are over-encumbered, then you should strongly consider short selling because I do not believe appreciation will be drastic and your rate is probably high.
The November 2011 data should be out any day now. Feel free to contact me, and let me know if you would like to be informed when that data is released.
-JJM
John is the Vice President here at JohnHart, and as such is responsible for managing and directing the firm towards obtaining its ultimate goals.
He is also one of our main contributors on the Blog. (please see his profile page on the main site for more information.)


1 comments