What is Going on in the housing market of this quaint Southern California city?
Question: What is the Los Angeles foothill city that is immortalized in a classic “Beach Boys” song? If you said Pasadena (Song: “The little old lady from Pasadena”), then you are correct! One of the hottest markets in eastern Los Angeles County, Pasadena has been an expensive place to buy property for sometime now; but how has the market held up during these turbulent times?
At first glance many people might make the mistake of assuming that the market has taken a bit of a sour turn in this area (when looking at the month to month numbers), but when we back up and look at the data over a year or more we can really see that this market appears to be stabilizing.
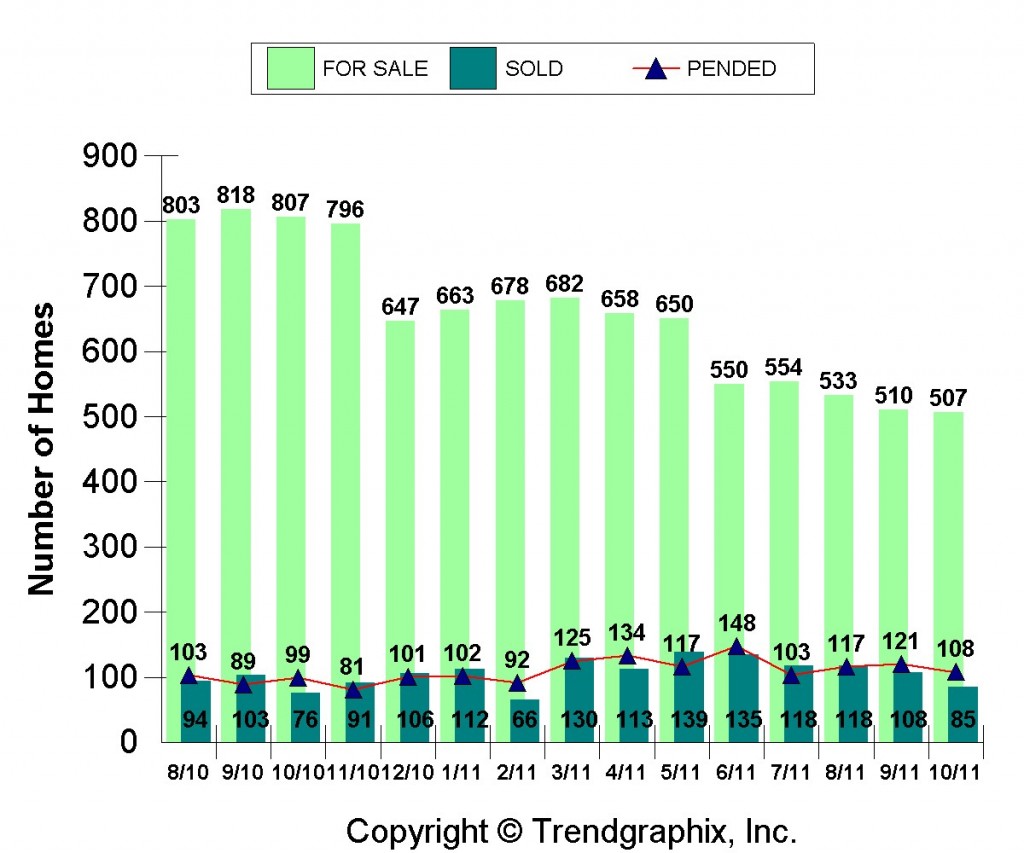
Let’s take a look at the graph below, which shows us the number of: For Sale Properties vs. Sold Properties vs. Pending Properties.
As you can see from the graph above there has been some pretty drastic changes over the past year, and none greater than in the number of properties actively listed on the market for sale. Looking at this chart it is hard to understand where I am drawing my conclusion that the market is stabilizing from; as there appears to be a heavy-handed downward trend. However, in real estate a decrease in supply often signifies a healthier local economy, and it can be reasonably assumed that prices will rise as well, in time.
Another strong “plus” for this market is that while the pending and sold numbers look like the have remained stable and not really improved, if you look at them in relation to the number of homes that were on the market, a significant increase in sales per month (percentage wise) has occurred. For example in October there were 85 properties sold vs. 94 sold in august of last year, however there were only 507 properties for sale in october vs. 803 properties for sale in august. Therefore while the number of properties sold decreased by 9, when you look at the numbers as a percentage of what was on the market, you can see that we have had an increase in sales of over 6% in the last 15 months.
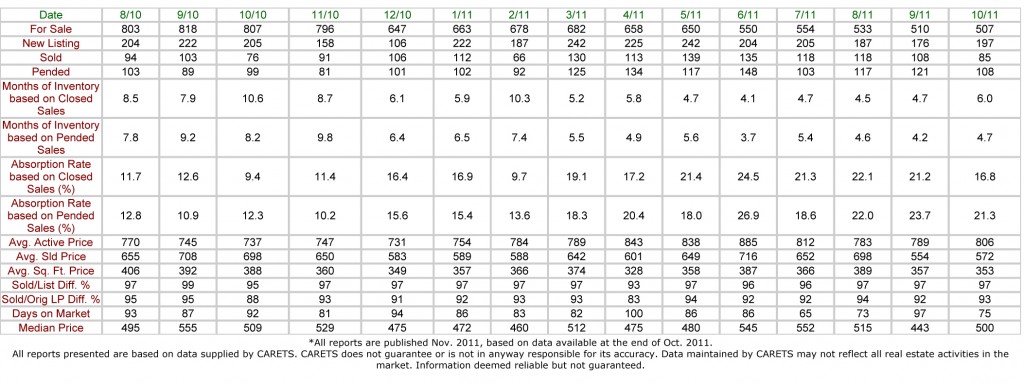
Just to ensure that our conclusion is correct, lets take a look at some key performance indicators below, in this data table.
In this table it is not hard to see that the median price has remained relatively stable, the avg. active price has has increased slightly, the days on market (number of average time it takes to sell a property, measured in days) is down, and the median price has remained pretty stable; all of which are signs of the market beginning to calm down and stabilize, at what most are referring to as the bottom!
What does this mean for you? The consumer, the agents, and the investor. What it means is that this market may start to gradually improve as it appears to be at a bottom currently. It also means that there are good deals to be had in this area currently.
Give us a call for more information, and have a wonderful day!
-JJM
John is the Vice President here at JohnHart, and as such is responsible for managing and directing the firm towards obtaining its ultimate goals.
He is also one of our main contributors on the Blog. (please see his profile page on the main site for more information.)


